Although most of us now have some idea of how to behave in the face of the COVID-19 pandemic, few of us understand how ‘the thing’ really operates, but we can still glean information from the freely available daily figures. Unfortunately, there are also a lot of politicians who don’t understand the virus very well either, despite having access to expert advice and a lot more information. One wonders if perhaps they had spoken more regularly to immunologist rather than economist, whether things would be different now, standing as we are on the pandemic side of the infection – somewhere quite different from that ‘nothing to worry about’ place that many of us were sleepwalking through all those days ago… way back in February!
Facing the lack of political direction some countries are experiencing, it is no bad thing to take an analytical approach rather than just adopting an opinion. Opinions can be interesting, but everything makes more sense when approached from an evidence based perspective.

There have been three ways to go with the COVID-19 pandemic and the approach has varied from country to country.
 1: Herd Immunity: Let people get infected and when a large percentage of the population has developed immunity the disease will drop away.
Several countries started out with this approach but abandoned it when rates of infection began to rise and put health services in danger of being overwhelmed. Sweden has held on to one version, but it’s less a ‘herd immunity’ policy, than a watered down version of self distancing, with children still at school, small businesses operating, and no travel restrictions. It might have worked out because Sweden has a low population, but there could be other reasons – perhaps even the cool Scandinavian approach to greeting one another has played its part; but as infections begin to rise, there is pressure building for a more rigorous approach to dealing with the virus.
 2. Personal distancing, isolation of the most vulnerable, and in extreme cases a total lock down: people will still get the disease, but the infection rate will slow enough to allow medical services to cope. Britain started with 1. found it difficult to hold infection rates to manageable levels and switched to 2.
 3. The South Korean and Taiwanese approach has been to combine technology with contact tracing, and use and aggressive strategy to limit the number of infections – this works well where people can be relied upon to follow instructions, but it doesn’t work everywhere. The danger is that the population will not get a high percentage immunity and the disease will returns from outside at a later date.
Only time will tell which approach gives the best results, but there is an indication that, in the end, all will lead to a similar outcome: rates of infection will vary, and the results come at different times. As yet, nobody knows what will happen, and there’s always a chance the disease could just run out of steam and disappear entirely, but as yet, shows no signs of doing so.
Things we should know when thinking ourselves through the COVID-19 pandemic.
It is helpful to know what is sometimes termed ‘the percentages’ to get a better understanding of how an infection runs. Although it doesn’t apply to all contagious diseases, a basic plan of fifths is a model applicable to many, and appears to work for COVID-19. The general rule for those infected is that four fifths will show trivial symptoms but still be contagious; one fifth will show more severe symptoms and one fifth of those with more severe symptoms will be in a serious life threatening situation.
Viral load doesn’t have so much arithmetic about it, but it is relevant, especially to medical workers. With other infective disease, it has been noticed that the first person in a family to contract a contagious disease will sometimes show less severe symptoms than others members of the family who later become infected. The suggestion is that the level of a virus contracted can increase the severity of an infection. If this story proves to be more than just anecdotal, it might explain why health workers are at such great risk, especially when intubating patients (inserting and removing a tube into the trachea to aid breathing). At such times they are subjected to high levels of the virus. This merits a mention because so many health workers have been poorly provisioned with adequate protective clothing which is entirely unacceptable, considering how long some authorities have had to prepare.
 With any serious viral infection one of the most important considerations is to understand what exponential growth really means: it is a progression of numbers that double up over a period of time; this sounds easy to understand, but few people fully comprehend the consequences of this form of increasingly rapid growth. If a disease is increasing exponentially, it is possible to recognise the end game by reading the figures correctly in the early stages: essentially it is a question of identify what you are dealing by understanding the numbers. I have outlined the details of this in a previous article: ‘Take a Picture – Save the Planet. UP, UP AND AWAY. From Ebola to Exponential and Beyond.’ and all I need to say here is, that whenever you see an exponential curve and have some kind of negative relationship with it in its later stages, then ‘Be afraid. Be very afraid’… This sounds extreme, but many of the problem issues we currently face, especially those relating to the environment involve dealing with exponential growth, because when you get to the steep end of the curve things can get critical.
 Go back a few generations and consider the affects on our world of such activities as burning coal, oil use and rapidly increasing human population – they all looked very different when our ancestors were standing lower on the curve, well before the steep climb that typifies exponential. Back then many might have rejected ominous predictions about the future based upon the way things were looking, but somebody reading the figures correctly could have accurately predicted the problems that we are now facing. The same might be said for COVID-19, as the spread of the disease has been growing exponentially, but when the virus started out, it didn’t sit on the lower slopes for very long, but immunologist were still able to predict from a very early stage where things were heading, while many a less well informed individual, didn’t anticipate any problems.
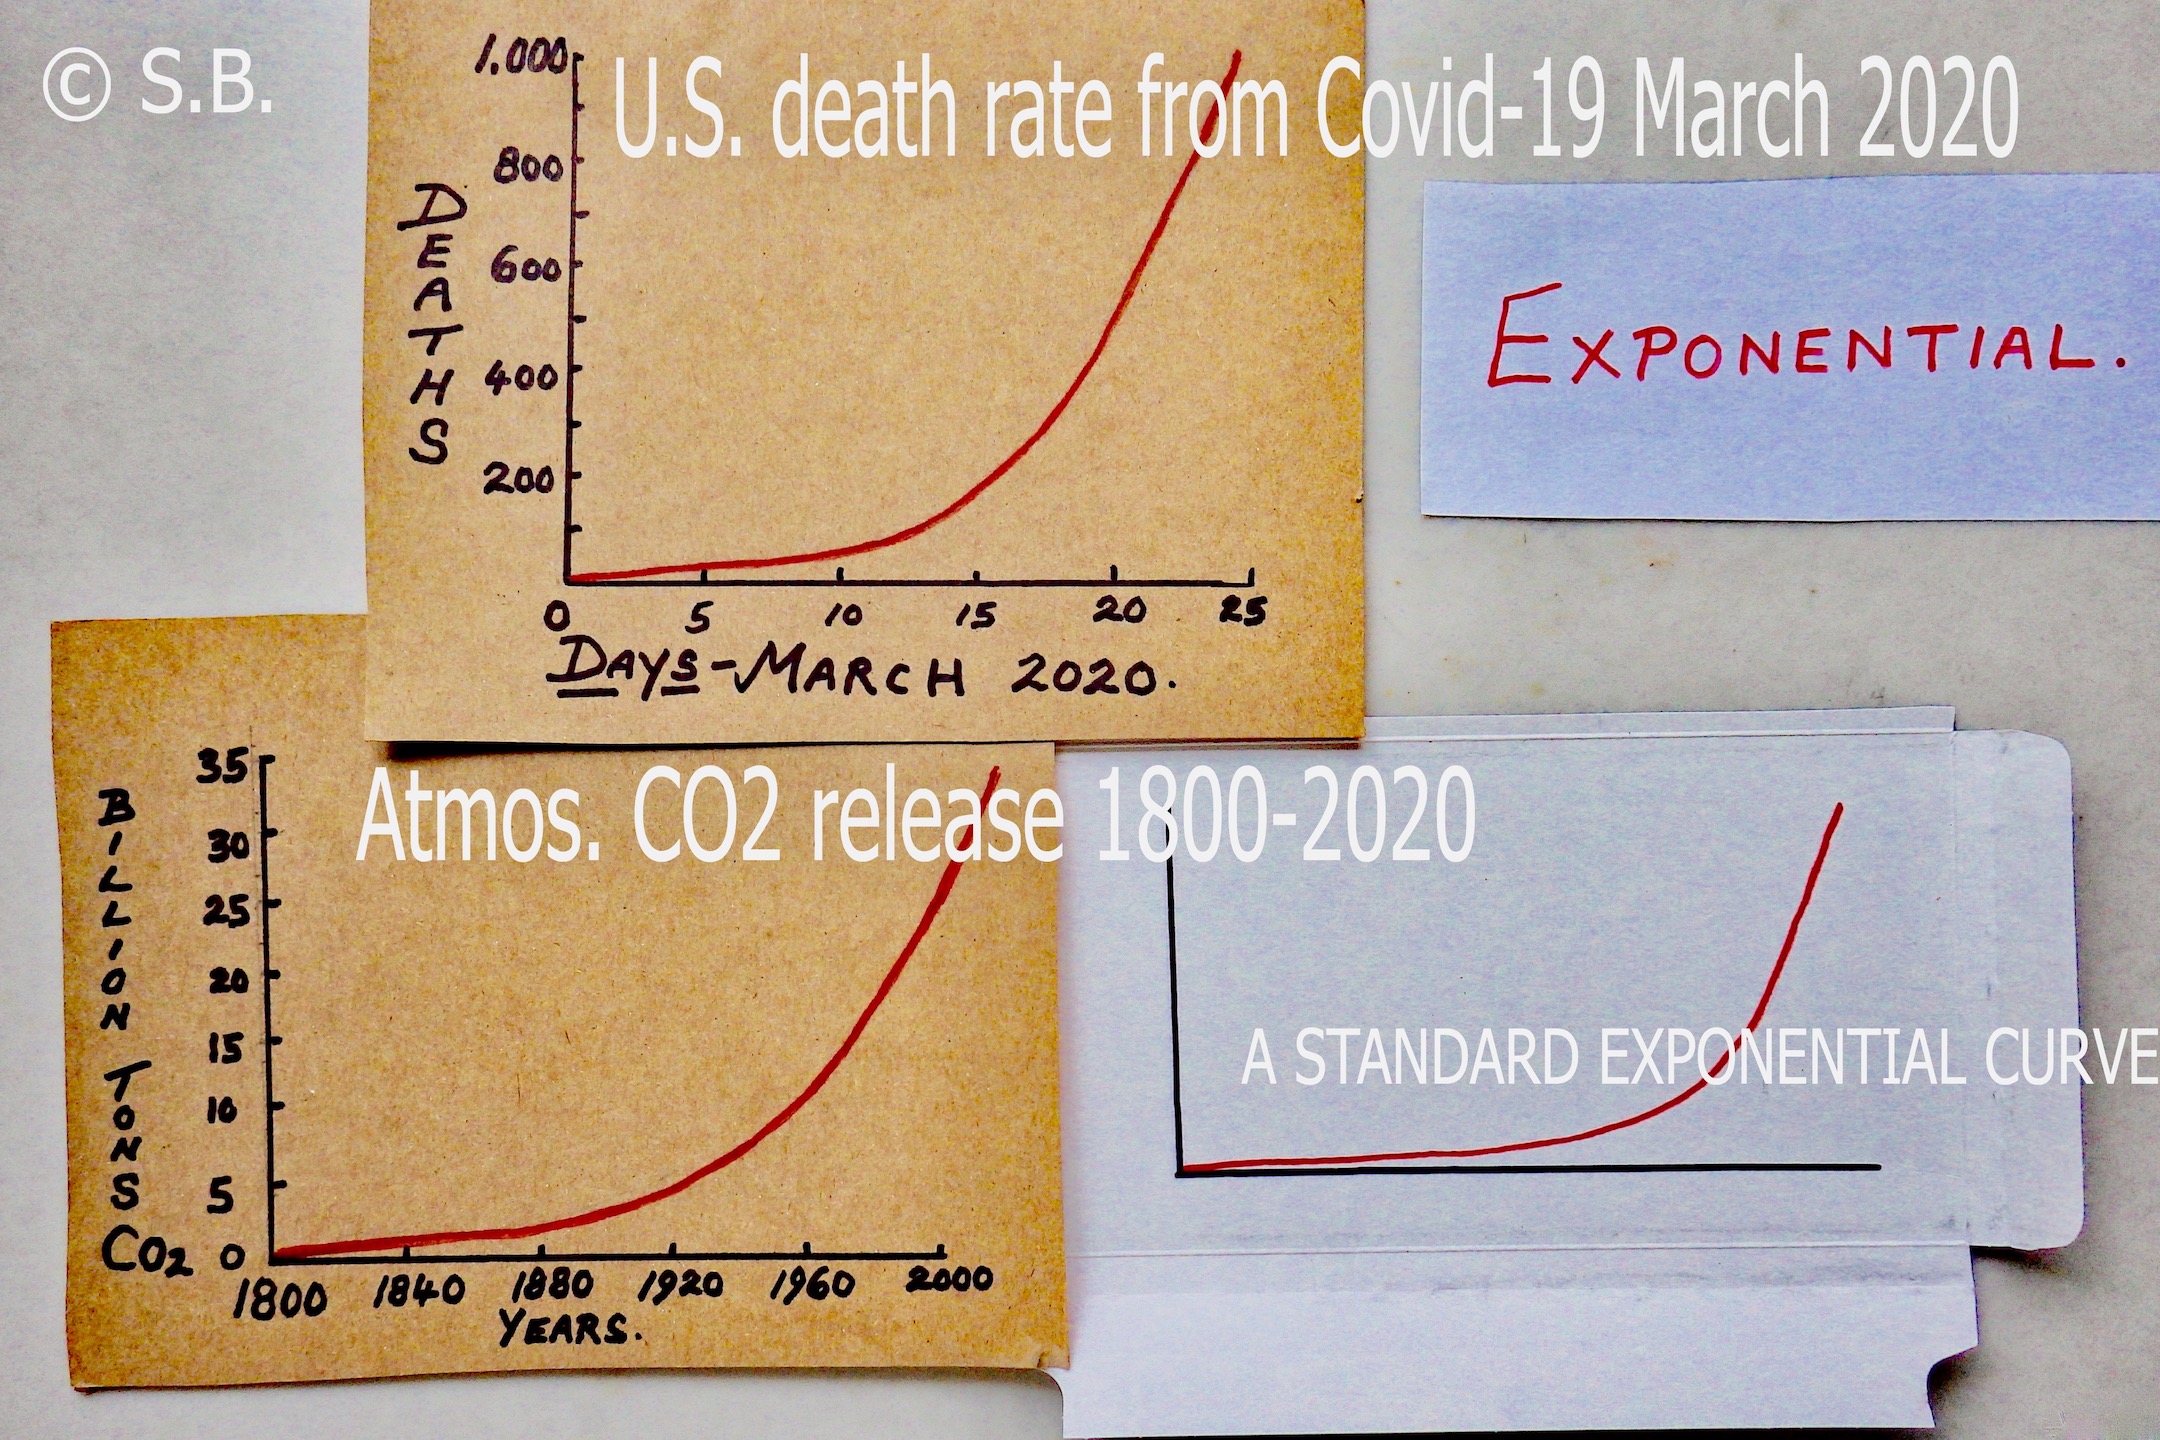
One of the graphs above, shows the U.S. death rate from COVID-19 through March 2020, and another, the release of C02 into the atmosphere between 1800 to 2020: both look exactly the same but they have nothing in common, other than being examples of exponential growth. With the CO2 graph I’ve ignored figures prior to 1800, to make the similarity clearer, but we shouldn’t make a habit of ignoring data, because cherry picking is a frequent misuse of statistical analysis to re-enforce selective points of view. Here it has been done only to demonstrate the shape of a curve with no intention to deceive.
Because COVID-19 kicked off with a vengeance from absolutely nothing and there is consequently no gentle rise of the lower slope of the curve for the U.S. Covid 19 figures, I have added ‘A STANDARD EXPONENTIAL’ curve which is often called the hockey stick curve. This indicates a calmer foothills slope, where the signs of exponential growth can still be read and what lies ahead is easily predictable. The question is whether the problem gets picked up and recognised as the get out of jail card it can sometimes be.
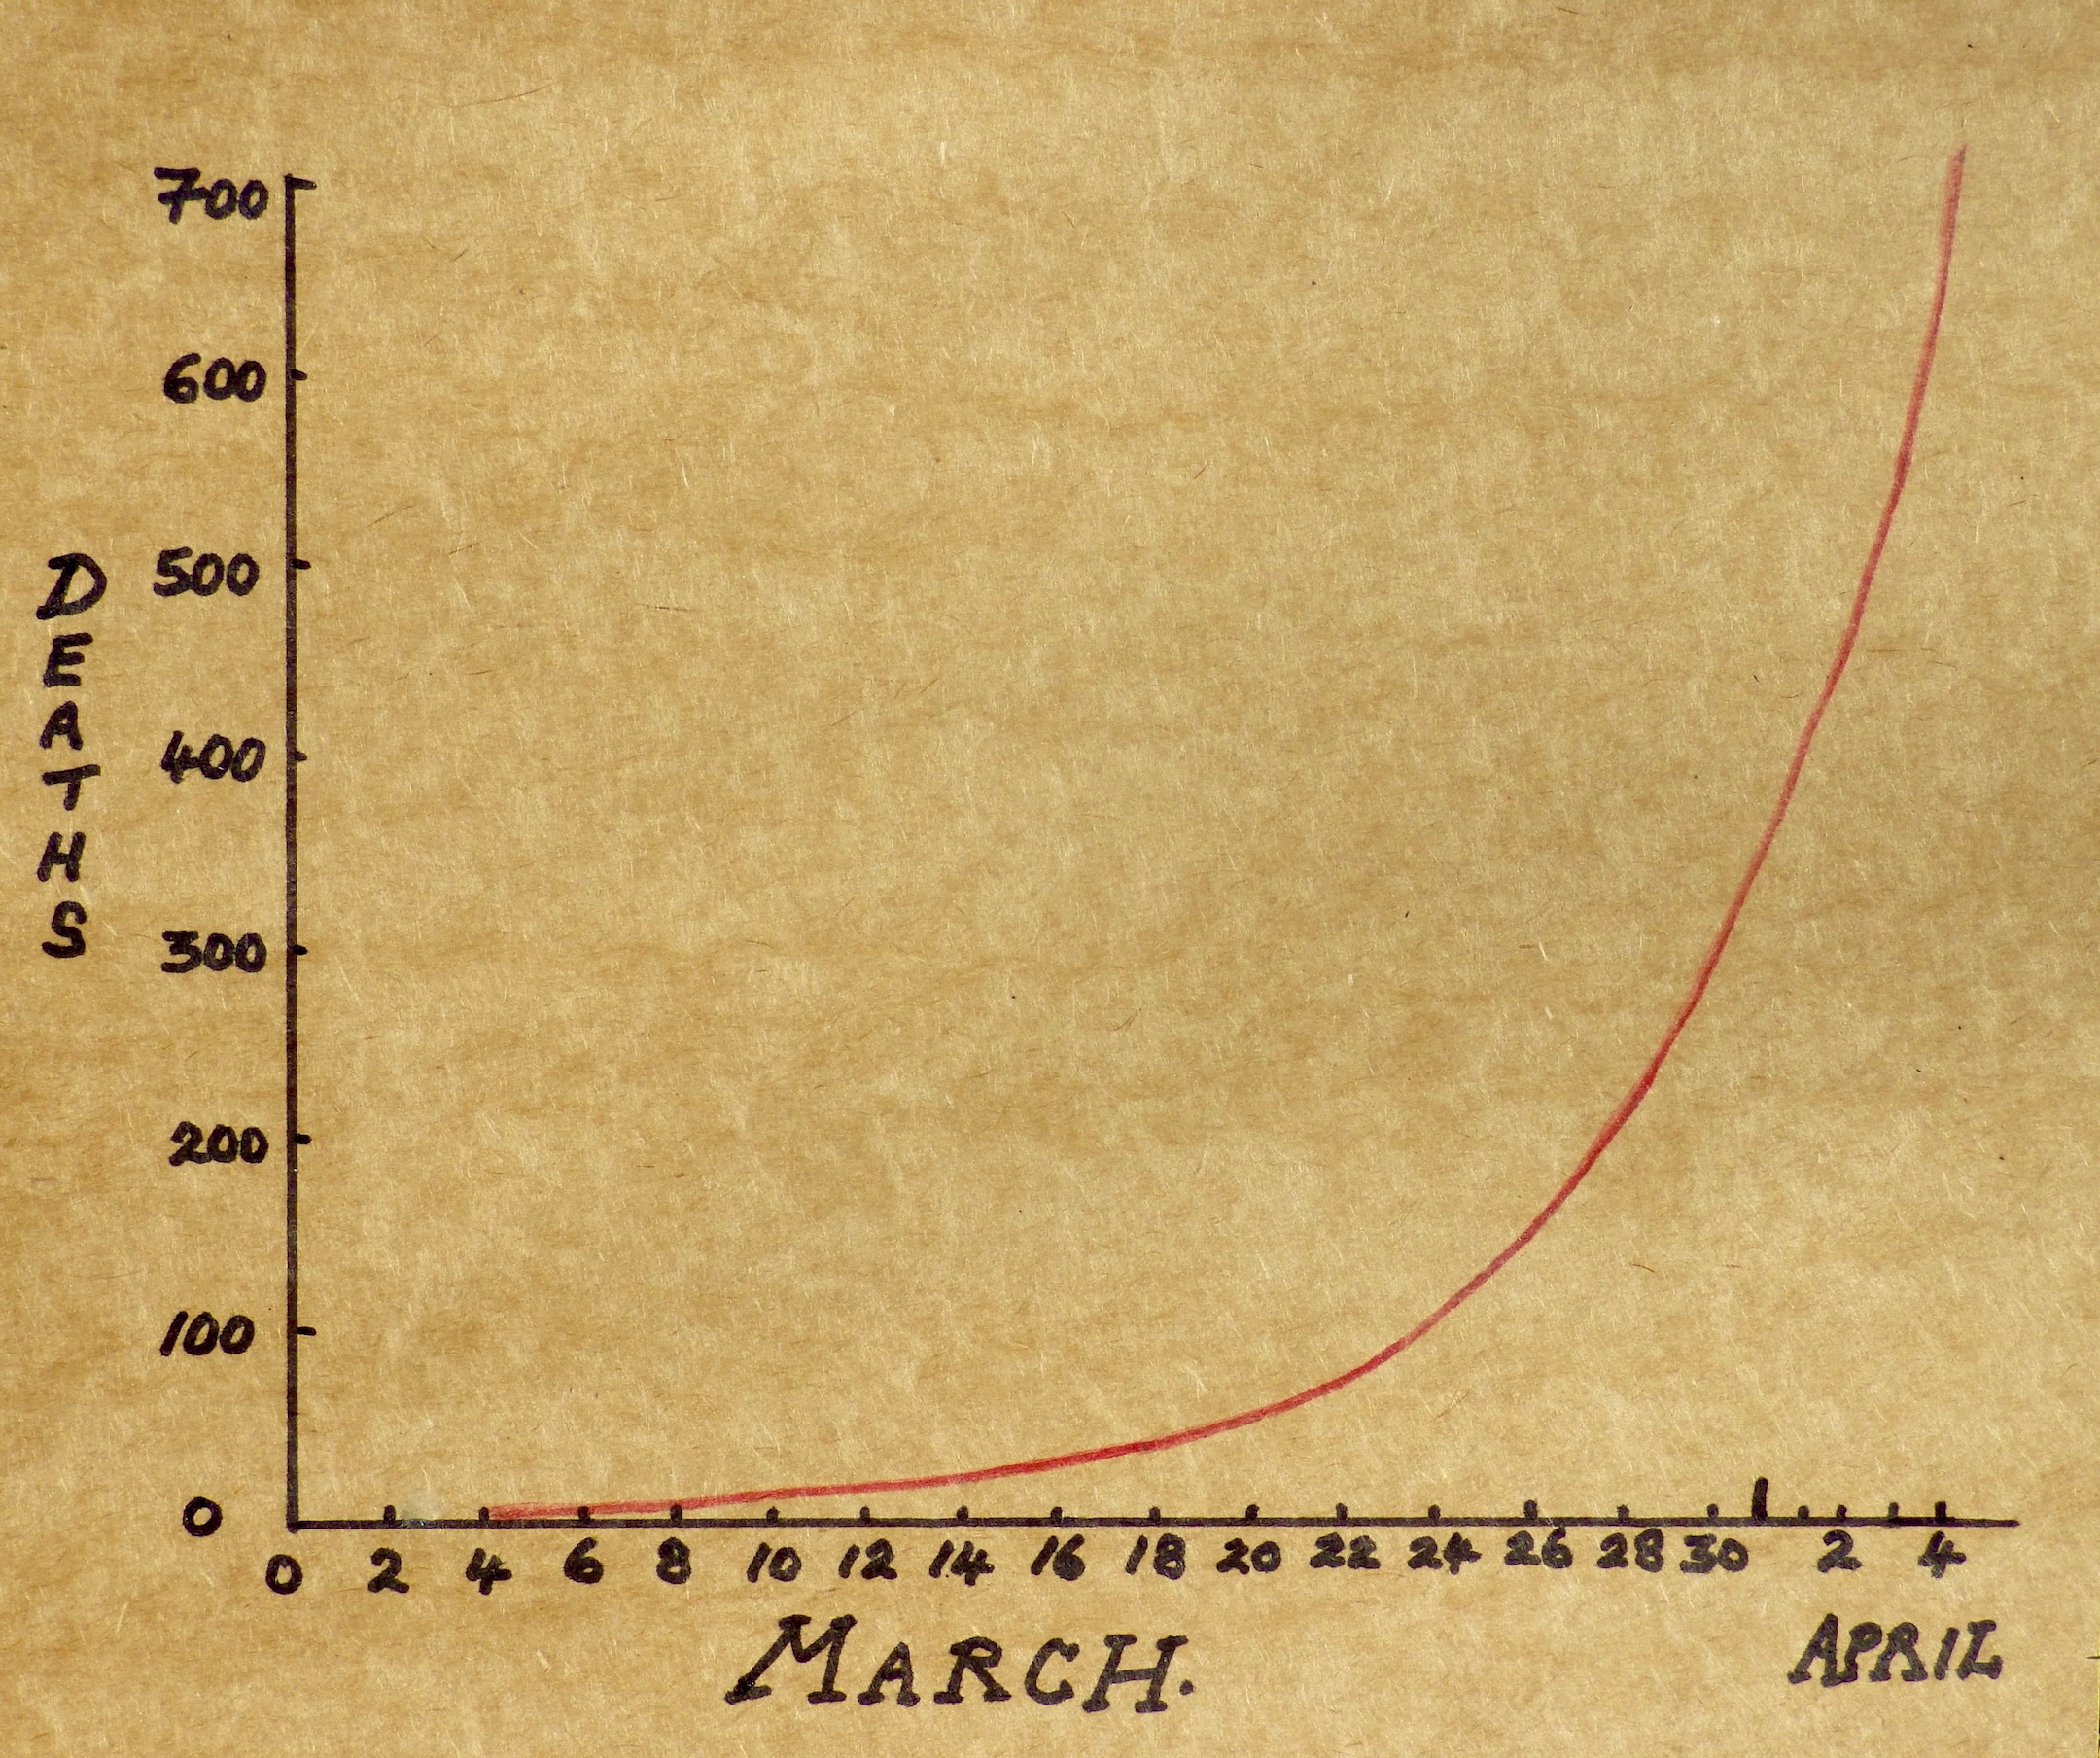 Sadly, by the time of writing (around 5th April), deaths in Britain caused by COVID-19 began to show a progression that looks exactly like most other exponential growth curves. Go back to the 22nd March when the figures were far lower and you might not predict what was to come. Unless they were reading the numbers, and might have been surprised by the steep rise to follow. 30th March: 180/ 31st:38/ 1st April: 563/ 2nd: 569/ 4th: 708/ 5th: 621. The way things have run elsewhere that have shown similar infection rates, the likelihood is that infections and deaths will slow over the next week or so, the numbers are about to plateau but exactly when will to some degree depend on public behaviour. If people continue to stay at home and bring down infection numbers it will certainly make a longterm difference – longterm being only a couple of weeks now as we live through the new reality of virus time.
 Any of us can get daily figures on this disease for almost anywhere in the world; the death rate in particular is difficult to misrepresent – although when people die outside of hospital they are not always recorded as a COVID-19 case. Certainly in the U.K. there hasn’t been widespread testing of the general population, and without that it is difficult to assess who is infected; and it skews the percentages in relation to the number of people dying (the death rate is what it is, but the infection rate is probably higher than reported); and this general lack of essential knowledge about the disease is disconcerting.
Nevertheless, predictions for the rate of COVID-19 infections have been easy to make by simply interpreting the day to day figures we do have, as any error in the records will remain constant and make it possible to extrapolate the graphs appropriately. Sadly, many elected officials ignored the finer details of the growth rate and were slow to take action, and this had an affect on the infection rate at a later stage of the disease. Either, they didn’t understand the horrors that an exponential curve represents, or they were wishful thinkers, hoping for better outcomes.
Even the most optimistic amongst us must at some stage face reality: with infection numbers doubling every three to four days it should have been obvious that infection rates would get out of hand unless there was a rapid response: which might include social distancing, self isolation, some form of treatment or a vaccine, although the latter two options are presently unavailable. It is difficult not to feel that in both the U.K. and to a greater extent the U.S., authorities were slow to recognise the exponential nature of the disease, even when they had a clear model of what was likely to occur by observing countries like Italy that were already going through a later stage of the infection. The U.S. had at least a two week jump on some of the countries in Europe, but whatever the case, many countries did not prepare adequately .
 There are many examples of exponential growth that are important to us, in particular those relating to the environment, there wouldn’t be a problem if space and resources were unlimited; certainly we run our economies as if this were the case, ignoring the absolute reality that we are living in a finite world. Now we are troubled by the steep ends of so many exponential curves, with doubling times arriving so quickly and numbers so massive, the likelihood that if we can continue the way we are drastic changes with be forced upon us, and some are already suggesting that the COVID-19 pandemic is a sombre reminder of how vulnerable we are.

In the natural world biological systems often run in cycles with a complex web of feed back mechanisms to limit any one thing from throwing the system out of balance. Since the development of our various technologies, humans have to varying degrees been living outside of the general rules imposed by natural systems; but we can’t control everything – there are chinks in the armour of our existence and it won’t be the last time we come under attack from a micro-organisms such as COVID-19. Viruses are reasserting nature’s influence and we’re learning lessons from a simple parasitic organism we cannot see, that is benefiting enormously from our close social interactions and high population numbers, and with deadly consequences.
 Immunologists have been waiting for the inevitable, and now it has arrived we should be taking advice from those who saw it coming. This we are told is a hundred year event, but immunologists know better – our lifestyles are very different from the way they were a hundred years ago. Our population, relentless consumption, and ability to travel almost anywhere in the World have combined to make us vulnerable, and if a novel virus had hands we’d be playing right into them. It should be no surprise that we are battling a pandemic; with this perhaps an indicator of the kind of wars we will be fighting in the future.
The last pandemic occurred in 1918, it was caused by a bird related H1N1 virus incorrectly named Spanish flu – and it was never cured, never seen – there were no electron-microscopes back then. This was like no flu ever experienced. In a worst case scenario, a person might feel unwell at breakfast and be dead before their evening meal, but despite its virulent nature the disease eventually burnt itself out, having infected some 500 million people, and caused some 50 million deaths. Every viral infection has its own signature: this one carried off the most youthful and healthy wherever they gathered together, with young men fighting together during the 1st World War especially vulnerable; but this terrible toll on humanity was soon to pass from collective memory. When I was a child, remembering Two World Wars was an oppressive part of life in Britain, but there was never any mention of the virulent and deadly influenza that killed many more people than had died in the First and Second World Wars put together. From an American perspective it killed more U.S. citizens than all of the wars fought by the United States through the entire 20th Century and yet we have chosen to ignore it.
 A novel disease like COVID-19 can start from a single infection, and because the new host (in this case, us) has no developed resistance, the infection rate can increase exponentially. How much slower the rate of growth would be if the virus reproduced over the same time period as we do – say 25 years per generation. If we had that kind of time we’d undoubtedly defeat such a disease in its early stages, but viruses work on a different schedule: they have places to be and a natural ability to get there shockingly fast – so we need to move fast to.

Once Inside the human body, infective viruses are usually in a rush to double their numbers by dividing, and this leads to our next point of arithmetic interest – infection rates, which are measures of how frequently the virus can be successfully transmitted to other individuals. With COVID-19 infections double up every three or four days, in the U.K.. It took 13 days to go from 1 death to 100. 10 days to go from 100 to 1,000. There are only 5 numbers here; usually far too few to come to a conclusion about anything, but these numbers tell us an awful lot. I could complicate the issue by claiming that after another 4 days COVID-19 had infected another 1,000 people… but that’s predictable… so I won’t bother.
The Ro Value
is the Basic Reproduction Number (or Ratio). Such numbers are usually based on models and often quite specific in their use. We might think of the Ro Number as a general measure of infection, but that’s not quite right; the Ro number cannot for example be modified by vaccines, and is mostly used as a way to ascertain if a disease is developing in a population. If the Ro value is less than 1, the disease will not be spreading because it is in decline, but above 1 the infection will be growing, and the larger the Ro value, the more difficult the disease will be to control. There are other factors when considering how fast a disease can spread, the numbers of people in a population that are vulnerable, there are many factors, but none of them stop an Ro value from being a useful indication of how an infection is spreading.
 If we see an Ro figure of 2 then it is rather like watching cell division in a petri dish i.e the growth is doubling up in an exponential manner and after less than a dozen doubling ups the numbers begin to get quite large and the disease may become difficult to control. Whether or not a disease becomes a problem depends on many things, the most obvious being how a disease is spread and how frequently that occurs. Ebola had an Ro of 2 and I’ve considered this disease in a previous article. The Ro for Covid-19 has been given during its history as having values that range from 2 to 3, sometimes 4 and quite a lot in between. All we need to know is that the higher the value the bigger the problem and that ascertaining an Ro number early on is important when estimating a diseases progress.
Dispelling the ‘Don’t Worry It’s Just Like Flu’ Myth.
Unfortunately early in the outbreak Donald Trump compared coronavirus with flu, but this was misleading. In the U.S. between 5 and 20% of people can expect to get flu during the course of a year, 200,000 will become seriously ill, and up to 20,000 will die.
The death rate of seasonal flu we know is typically around 0.1%. but during the early stages of the infection in mainland China the death rate for COVID-19 was estimated at anything between 0.4 to 2.9%; and as the virus could infect between 50 to 80% of a population very quickly, and there was no vaccine or cure, the situation was potentially very serious.
 On 24th March a worried Governor Andrew Cuomo said that it was coming across the U.S. like a bullet train as N.Y. cases topped 25,000 with 200 deaths – he didn’t use the term exponential growth, but did say the rate of infection was doubling every 3 days. New York was Ill prepared for the onslaught and the Governor was understandably worried. You don’t need to be an epidemiologist to know the difference between seasonal flu and COVID-19, the former doesn’t put your health service into total breakdown but COVID-19 can do so in a matter of days, particularly when the infection rate is climbing the steep part of that exponential curve – and you don’t have to dither very long before experienceing the full force of the disease.
It’s a Matter of Life or Death:
 This has been a time when Governments needed to interpret available information, make decisions and then act very quickly, but they haven’t always done so. Computer simulations have been of great importance in the process, but many indicators of the path that should be taken have been ignored. In the U.K. ex-government minister Phillip Lee has spoken about a computer simulation of a pandemic undertaken a few years ago in order to inform government strategy, utilising an outbreak of a virus similar to SARS. One of the results of the exercise was that it indicated, even when there were both treatments and a vaccine available, there would not be enough ventilators for the predicted number of patients. The obvious question is: why the government didn’t react to this important information? Most likely there was a belief that the chances of a SARS like pandemic was low, but when COVID-19 kicked off, why wasn’t there a more rapid reaction to the emergency? Certainly it has been shameful that very basic supplies of protective masks, goggles and clothing have been in short supply and very limited testing even of medical staff for the virus. This to most people is unacceptable; health workers on the front line need more than just a round of applause. Having witnessed the outbreak in Italy, and even earlier when the virus became a problem in China, there was time to react, but preparations for the spread of the virus were unacceptably slow.

In Britain there was further criticism because testing is essential for monitoring the spread of the disease and it has failed to do this adequately, even when the disease was running up the steep end of the exponential curve. Some countries have been more efficient in their dealings with the threat. Germany for example was setting up testing labs fairly early on, but Britain did not react as quickly, and put all their efforts into a single dedicated lab – this to ensure standardisation of testing, in preference to using university and other laboratories around the country that had volunteered help. The government project then had problems accessing chemical reagents required for their tests because these weren’t purchased early enough. In consequence the system hasn’t been moving fast enough to deal with even the most basic number of tests – they soon might though, as help has now been accepted from some of those other labs, but it could all be coming rather too late.
 Both of these stories came out on the same day that Britain reported 563 deaths from Covid-19. It was April 1st All Fools Day – unfortunately the virus moved with great speed, but of course governments are not usually so good at doing that and the result almost certainly will be be a greater loss of life. A thoughtful person might be wondering how we will look back on this predictable situation that got very much out of hand. Maybe it just hasn’t been a fair fight – the virus has been efficient and has moved very fast, while governments in general… Well, perhaps not so much.
Now is not the time to draw too many conclusions, but at some stage, after we’ve worked out exit strategies from the present pandemic (and that’s a whole other story in itself), there will have to be questions asked. The next time a pandemic occurs, which if nothing much changes is a certainty, we must be better prepared for the fight. We owe that much at the very least to all of those who have so far lost their battle with this deadly enemy.
Next: COVID-19. Simple Arithmetic and the ‘Economy First’ Delusion. PART 2.


